Web3 Infrastructure Health Scorecard: A Deep Dive
This document provides an in-depth analysis of the Web3 Infrastructure Health Scorecard, breaking down each pillar and metric to understand its significance and how it contributes to the overall health and scalability of a Web3 project. The scorecard assesses critical aspects of a project's infrastructure, from provider resilience and engineering velocity to economic efficiency and observability, offering a comprehensive view of its strengths and weaknesses. By understanding the scoring system and the implications of each metric, projects can identify areas for improvement and ensure a robust and sustainable infrastructure.


David Liu
CTO & Co-Founder
Blockchain
10 Minutes
Pillar 1: Provider Resilience & Portability
This pillar focuses on the ability of a Web3 project to withstand service degradations and maintain operational continuity. It assesses the project's reliance on specific providers and its ability to switch between them seamlessly.
Failover Speed: This metric evaluates how quickly a project can switch providers in the event of a service disruption. A score of 4-5 indicates the ability to switch providers in under a minute without code changes, demonstrating a high level of resilience. A lower score suggests a dependency on a single provider or a complex failover process, increasing the risk of downtime.
Audit Reality Check: Can you actually switch providers in <1 min without code changes? This requires automated failover mechanisms and a provider-agnostic architecture.
Vendor Independence: This metric assesses the degree to which a project's business logic is tied to specific provider SDKs. A high score indicates that the project is built on open standards and can easily integrate with different providers. A low score suggests a strong dependency on a particular vendor, limiting flexibility and increasing the risk of vendor lock-in.
Audit Reality Check: Is your business logic free of partner-specific SDKs? This requires careful design and the use of abstraction layers to decouple the application from the underlying infrastructure.
Multi-Source Sync: This metric evaluates whether the project verifies state (block height) across multiple sources. This is crucial for ensuring data integrity and preventing reliance on a single source of truth. A high score indicates a robust verification process, while a low score suggests a vulnerability to data inconsistencies and potential manipulation.
Audit Reality Check: Are you verifying state (block height) across multiple sources? This requires implementing mechanisms to compare data from different providers and identify discrepancies.
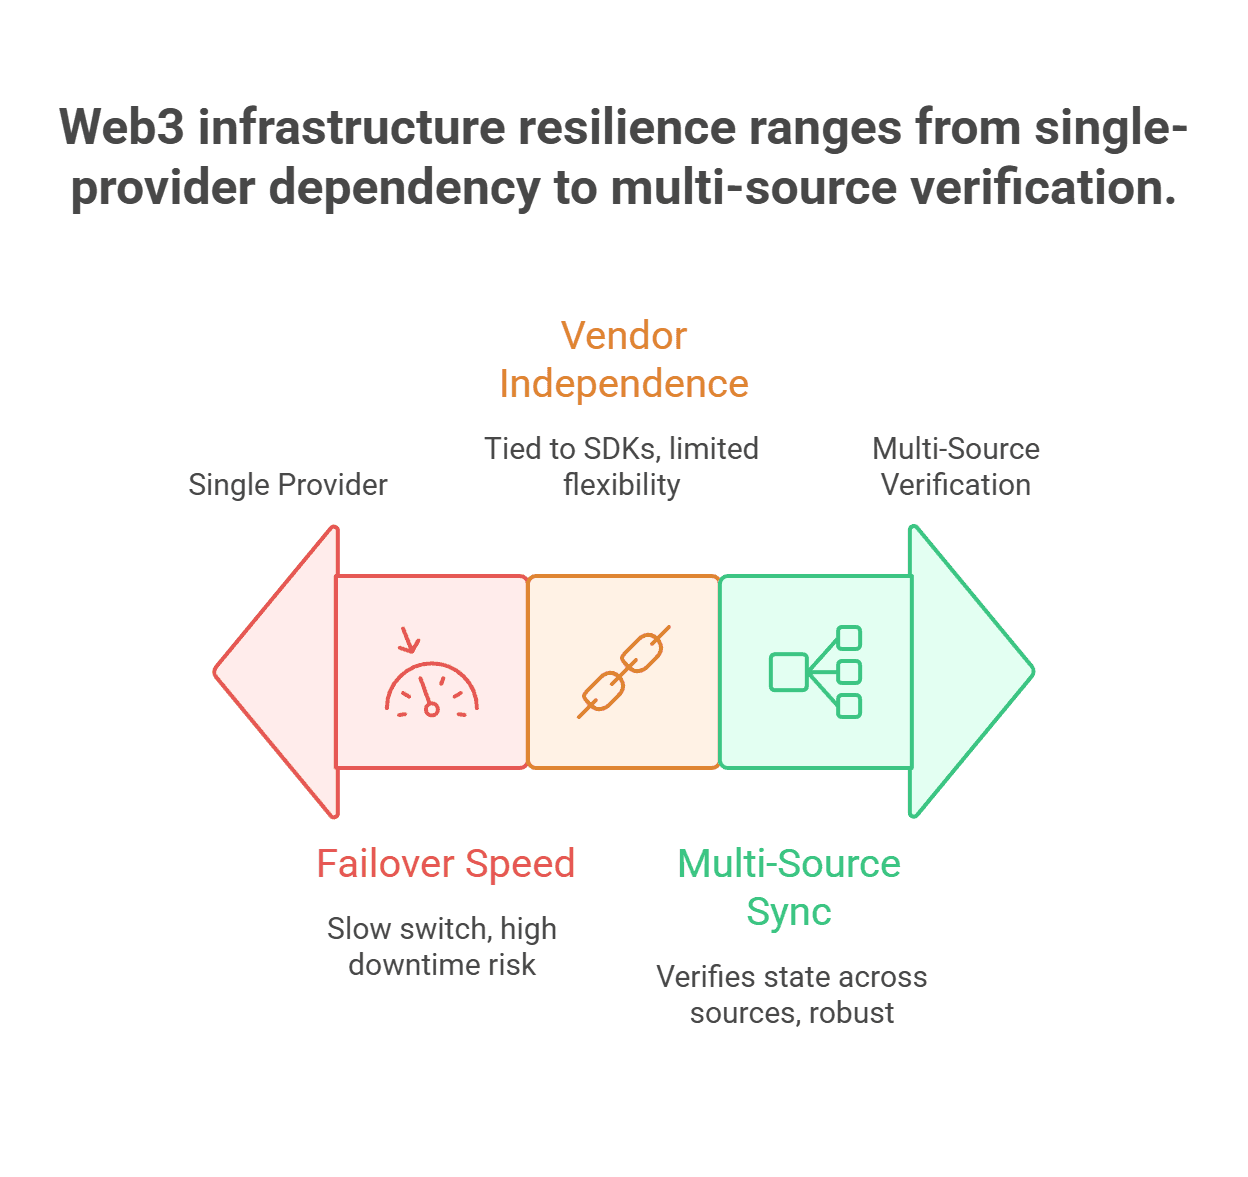
Total Section Score / 15: This score reflects the overall resilience and portability of the project's infrastructure. A high score indicates a well-designed system that can withstand service disruptions and adapt to changing market conditions.
Pillar 2: Engineering Velocity & Maintainability
This pillar focuses on the efficiency and maintainability of the project's engineering processes. It assesses the ease with which new chains can be integrated, the uniformity of the data schema, and the automation of error handling.
Onboarding Speed: This metric evaluates the time it takes to add a new chain to the project. A score of 4-5 indicates that a new chain can be integrated in under 4 hours of engineering time, demonstrating a high level of efficiency. A lower score suggests a complex and time-consuming onboarding process, hindering the project's ability to adapt to new opportunities.
Audit Reality Check: Does adding a new chain take <4 hours of engineering time? This requires a modular architecture and automated deployment processes.
Schema Uniformity: This metric assesses whether the project's frontend uses a unified schema for all chains. A high score indicates a consistent and well-defined data model, simplifying development and reducing the risk of errors. A low score suggests a fragmented schema, increasing complexity and maintenance overhead.
Audit Reality Check: Does your frontend use one unified schema for all chains? This requires careful design and the use of data transformation techniques.
Retry Automation: This metric evaluates whether error handling is managed by an intelligent middleware. A high score indicates that errors are automatically retried and handled gracefully, improving the user experience and reducing the need for manual intervention. A low score suggests a lack of automation, increasing the risk of errors and requiring developers to spend time on repetitive tasks.
Audit Reality Check: Is error handling managed by an intelligent middleware? This requires implementing a robust error handling system that can automatically retry failed requests and provide detailed error logs.
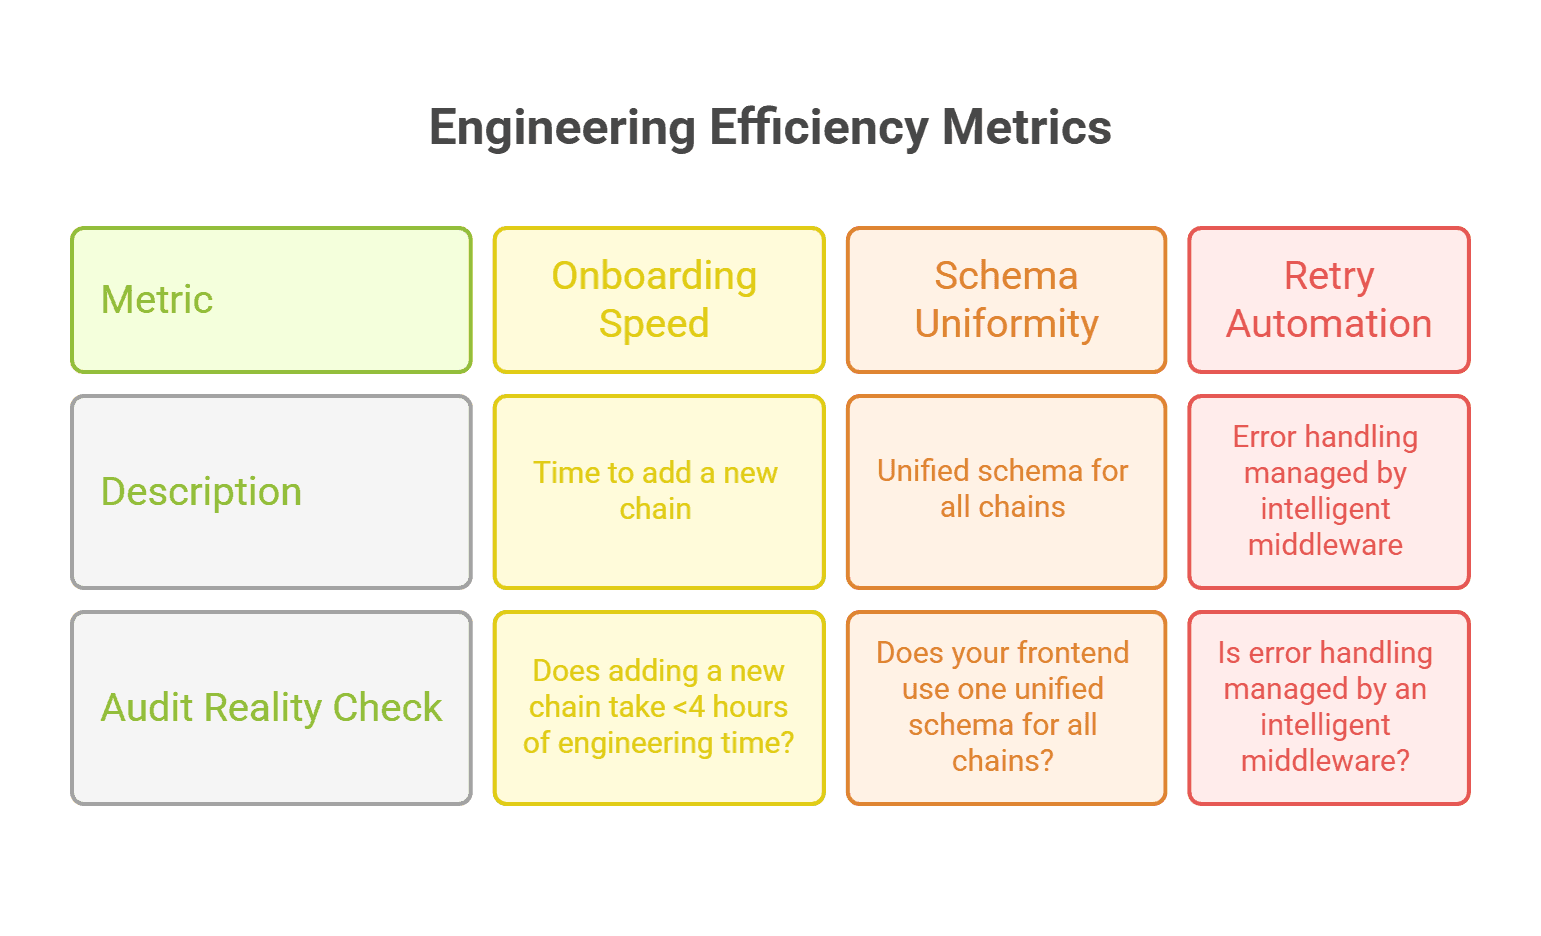
Total Section Score / 15: This score reflects the overall efficiency and maintainability of the project's engineering processes. A high score indicates a well-designed system that allows the team to focus on building new features rather than fixing infrastructure issues.
Pillar 3: Economic Efficiency (FinOps)
This pillar focuses on the cost-effectiveness of the project's infrastructure. It assesses the optimization of unit costs, the transparency of service level agreements (SLAs), and the ability to prevent budget overruns.
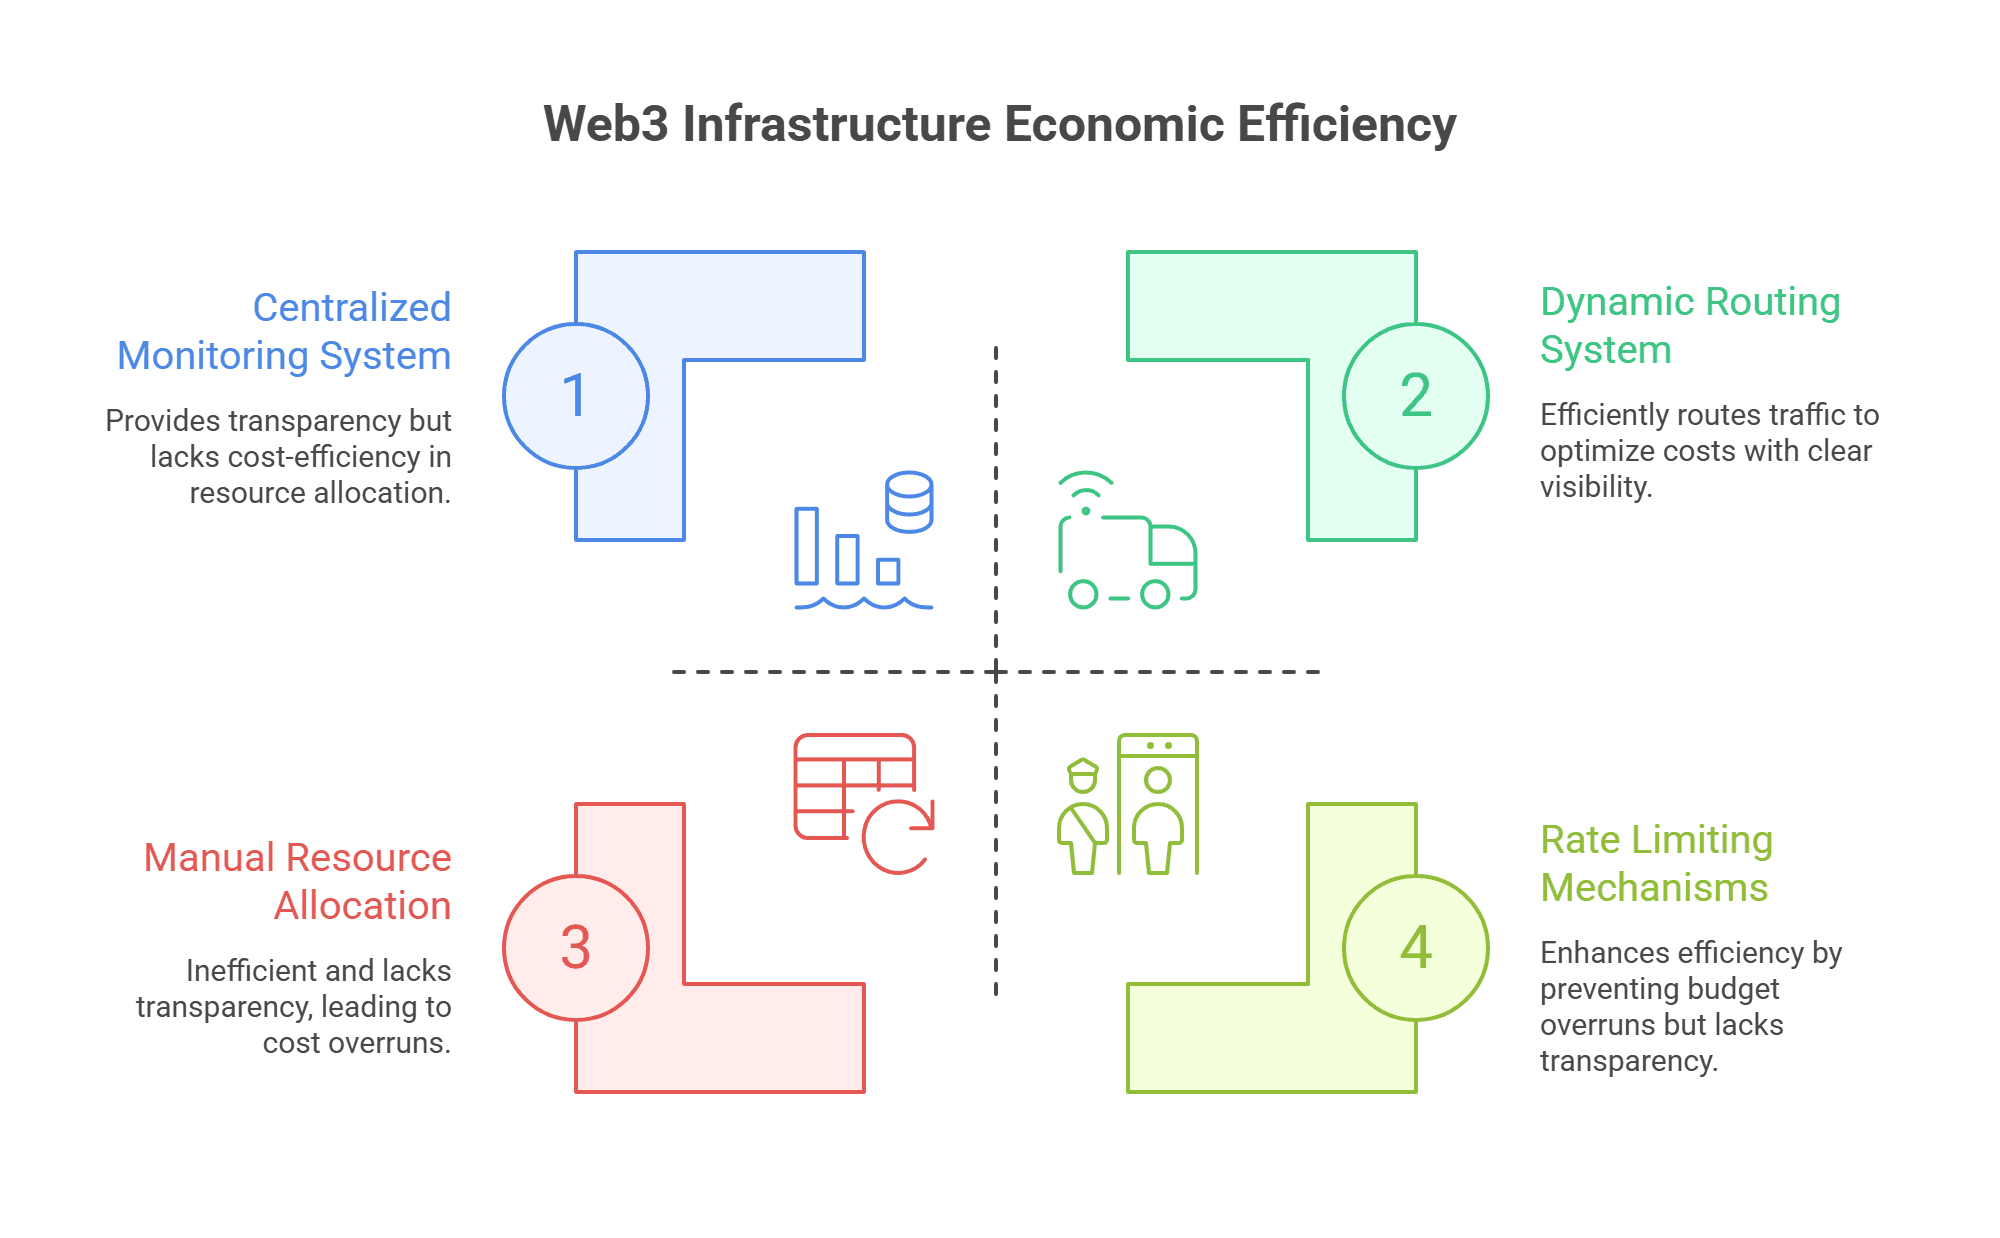
Unit Cost Optimization: This metric evaluates whether "heavy" reads are automatically routed to lower-cost tiers. A high score indicates that the project is efficiently utilizing resources and minimizing costs. A low score suggests that the project is overpaying for performance it doesn't need.
Audit Reality Check: Are "heavy" reads automatically routed to lower-cost tiers? This requires implementing a dynamic routing system that can intelligently allocate resources based on demand.
SLA Transparency: This metric assesses whether the project has a single view of latency/uptime across all partners. A high score indicates that the project has clear visibility into the performance of its infrastructure, allowing it to identify and address issues proactively. A low score suggests a lack of transparency, making it difficult to diagnose performance problems and optimize costs.
Audit Reality Check: Do you have a single view of latency/uptime across all partners? This requires integrating data from different providers into a centralized monitoring system.
Rate-Limit Guarding: This metric evaluates whether the project can prevent one rogue script from burning its monthly budget. A high score indicates that the project has robust mechanisms in place to protect against unexpected cost spikes. A low score suggests a vulnerability to budget overruns, potentially jeopardizing the project's financial stability.
Audit Reality Check: Can you prevent one rogue script from burning your monthly budget? This requires implementing rate limiting and usage monitoring mechanisms.
Total Section Score / 15: This score reflects the overall cost-effectiveness of the project's infrastructure. A high score indicates a well-managed system that optimizes resource utilization and prevents budget overruns.
Pillar 4: Visibility & Observability
This pillar focuses on the ability to monitor and understand the performance of the project's infrastructure. It assesses the centralization of RPC health data, the use of predictive alerting, and the ability to break down costs by specific RPC calls.
Unified Telemetry: This metric evaluates whether all RPC health data is visible in one centralized dashboard. A high score indicates that the project has a comprehensive view of its infrastructure's performance, allowing it to identify and address issues quickly. A low score suggests a fragmented monitoring system, making it difficult to diagnose problems and optimize performance.
Audit Reality Check: Is all RPC health data visible in one centralized dashboard? This requires integrating data from different sources into a single pane of glass.
Predictive Alerting: This metric assesses whether the project receives alerts before a provider hits a rate limit. A high score indicates that the project can proactively prevent performance issues and avoid service disruptions. A low score suggests a reactive approach to monitoring, increasing the risk of downtime and user dissatisfaction.
Audit Reality Check: Do you get alerts before a provider hits a rate limit? This requires implementing predictive analytics and setting up appropriate alerting thresholds.
Method Breakdown: This metric evaluates whether the project knows which specific RPC call is its biggest cost driver. A high score indicates that the project has a deep understanding of its infrastructure's performance and can optimize costs effectively. A low score suggests a lack of visibility into cost drivers, making it difficult to identify and address inefficiencies.
Audit Reality Check: Do you know which specific RPC call is your biggest cost driver? This requires implementing detailed usage tracking and cost analysis tools.
Total Section Score / 15: This score reflects the overall visibility and observability of the project's infrastructure. A high score indicates a well-monitored system that provides valuable insights into performance and cost drivers.
Interpreting Your Final Score
50–60: The Gold Standard: Your stack is fully orchestrated. Infrastructure is an invisible utility that scales with your growth.
30–49: The Scaling Wall: You have solid foundations, but manual maintenance is beginning to eat into your feature roadmap. It's time to abstract your data layers.
0–29: Ticking Time Bomb: Your project is at high risk of a single-point-of-failure outage or a budget-breaking cost spike. Addressing technical debt is now a critical business priority.
By carefully evaluating each pillar and metric, Web3 projects can gain a clear understanding of their infrastructure's strengths and weaknesses and take steps to improve its resilience, efficiency, and scalability.